DEMAND 2025
Evolution of the demand
Information based on provisional data as of January 2026

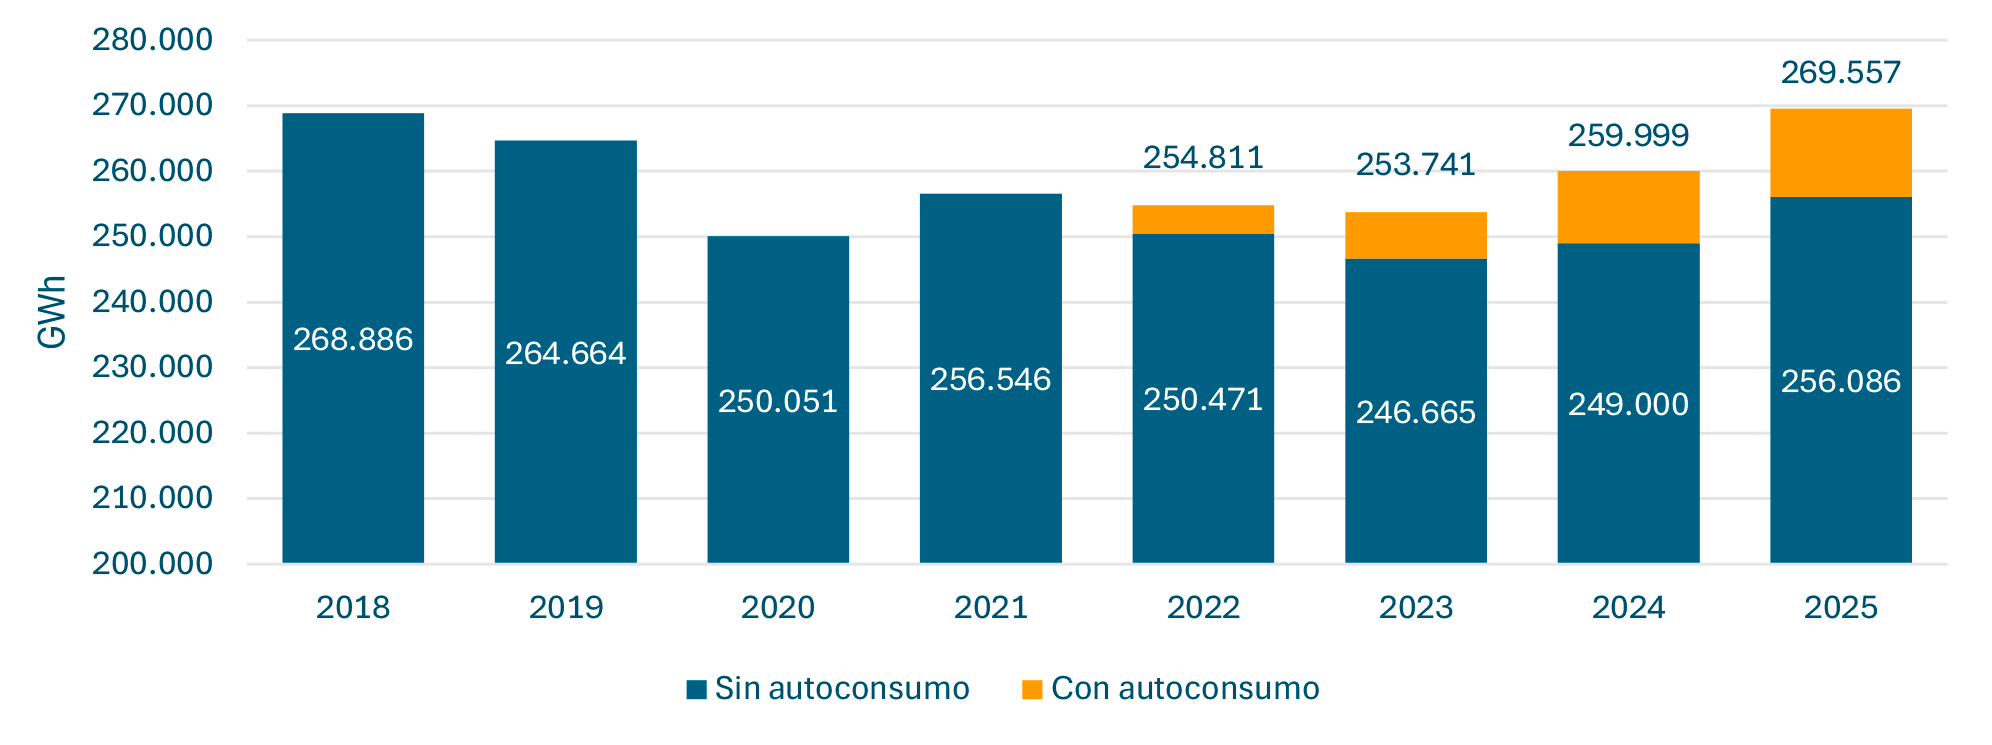
The demand for electrical energy in Spain during 2025 showed increased for the second consecutive year. This year, it was 2.8% higher than the previous year, reaching a total demand of 256,086 GWh.
In 2025, the Spanish economy continues to show considerable growth, once again standing out from the weaker performance of the main economies in our environment. This growth is once again supported by the strength of national demand, with household consumption showing particular dynamism and business investment recovering, driven by the rollout of European funds. Tourism continues to play a key role in driving economic activity, although its growth has been somewhat more moderate than in recent years.
Despite a complex international context marked by persistent geopolitical tensions, trade uncertainties, and the impact of certain economic policies in the United States, the Spanish economy continues to demonstrate strong resilience, with inflation contained at levels close to the European target and a labour market that continues to create jobs, albeit at a slightly slower pace than in previous years.
The year once again closes with some uncertainties regarding the evolution of energy prices and potential changes in international trade policy.
This context is reflected in electricity demand, which for the second consecutive year recorded an increase of 2.8% in 2025, reaching 256,086 GWh. If we take into account the energy generated by self-consumption installations, this figure would rise to 269,557 GWh, slightly above pre-COVID demand levels. If we including self-consumption installations, demand increased by 3.7%.
Evolution of the national demand
As for the evolution of the peninsular electricity system, which accounts for approximately 94% of Spain's total demand, it increased by 2.9% compared to the previous year, with a total demand of 240,341 GWh. Taking into account energy from self-consumption installations, this figure would stand at 253,367 GWh, a similar level to that recorded before the pandemic.
Changes in national demand over the last 10 years
Storage once again reached record levels, both in consumption (9,204 GWh) and pumped-storage turbine generation (5,886 GWh). These figures are 7.8% and 6.2% higher than in 2024, nearly tripling those recorded in the year before the pandemic. It is only natural for these values to increase, as pumped storage helps store as a tool supports the integration of renewables.
Additionally, batteries were charged with 9 GWh in 2025. Although these figures are not yet significant compared to pumped-storage facilities, their growth in the coming years will strengthen storage capabilities.
Annual evolution of the electrical energy balance
Other renewables: Include biogas, biomass, marine hydro, and geothermal.
Pumped storage: Pure pumped storage + estimated mixed pumped storage.
Combined cycle: Includes operation in open-cycle mode.
Peninsula-Balearic Islands link: Positive value: energy input into the system; negative value: energy output from the system.
International exchange balance: Positive value: import-oriented balance; negative value: export-oriented balance. Increment values are not calculated when exchange balances have different signs.
Evolution of the electricity demand coverage
Monthly evolution of demand at power station busbars
Other renewables: Include biogas, biomass, marine hydro, and geothermal.
Pumped storage: Pure pumped storage + estimated mixed pumped storage.
Combined cycle: Includes operation in open-cycle mode.
Peninsula-Balearic Islands link: Positive value: energy input into the system; negative value: energy output from the system.
International exchange balance: Positive value: import-oriented balance; negative value: export-oriented balance.
Widespread increase in virtually every autonomous community
On the Spanish Peninsula, all autonomous communities except Asturias increased their demand compared to the previous year. Eight of them (Aragón, Madrid, Comunidad Valenciana, Murcia, Cantabria, Castilla La Mancha, and Andalucía) recorded increases above the national average (7.2%, 4.8%, 4.4%, 4.2%, 4.2%, 3.6%, 3.4%, and 3%, respectively). Navarra, La Rioja, Castilla y León, Galicia, Cataluña, and País Vasco posted lower increases than the peninsular average (2.8%, 2.6%, 2.5%, 1.5%, 1.3%, and 0.3%). Asturias saw a 1% decline in demand.
Demand at power station busbars by autonomous communities
GWh
Islas Baleares once again recorded positive growth of 4.1%. Islas Canarias continued their upward trend, with an increase of 1.1%. Ceuta recorded a 4.8% increase in demand, while Melilla’s demand rose by 6.1%. All non-Peninsular systems reached levels similar to or higher than those recorded before the pandemic.
When self-consumption is taken into account, almost all autonomous communities show even higher growth compared to the previous year.
National electrical energy balance by autonomous communities
GWh
Electricity demand
Final demand: IRE
Electricity demand
Variation and components