EXCHANGES 2025
Cross-border physical energy exchanges
Information based on provisional data as of January 2026

Browse the content
For the fourth consecutive year, the physical exchange balance recorded a net export of 12,794 MWh.
Annual evolution of imports in physical international electricity exchanges in GWh
Annual evolution of exports in physical international electricity exchanges
Annual evolution of the balances of physical international electricity exchanges
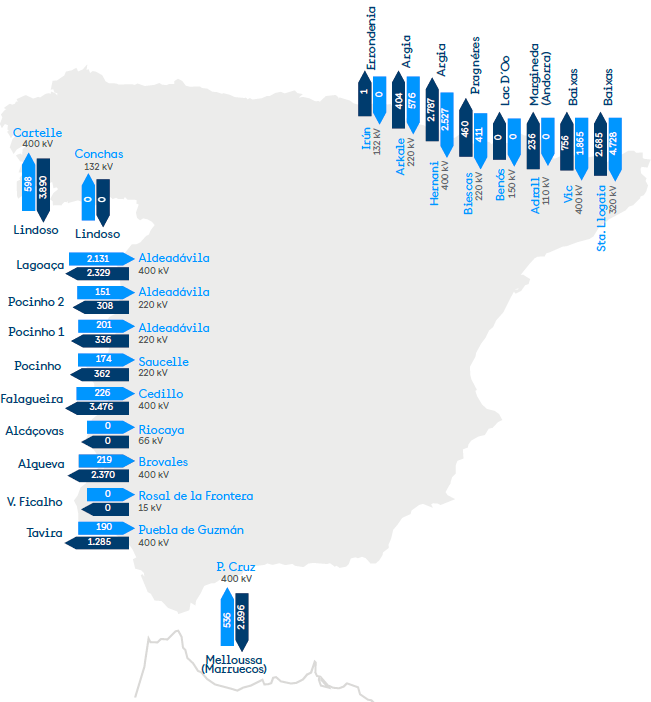
Map of physical international electricity exchanges
GWh
Cross-border electricity exchanges
Summary cross-border electricity exchanges
Cross-border electricity exchanges
Scheduled cross-border electricity exchanges